Running News Daily
Running News Daily is edited by Bob Anderson. Send your news items to bob@mybestruns.com Advertising opportunities available. Train the Kenyan Way at KATA Kenya and Portugal owned and operated by Bob Anderson. Be sure to catch our movie A Long Run the movie KATA Running Camps and KATA Potato Farms - 31 now open in Kenya! https://kata.ke/
Index to Daily Posts · Sign Up For Updates · Run The World Feed
Western States 100 Time Predictions Based On Historical Data
The Western States 100 is the Super Bowl of US trail running, just with fewer cryptocurrency commercials. Every year, the race gathers some of the best athletes in the world to test themselves on the world-famous course. The competition, along with comprehensive data gathering by the race organizers, provides a massive statistical opportunity.
Marshall Burke, associate professor of Earth System Science at Stanford University, seized that opportunity with some wonderfully cool data analyses heading into the 2022 race. The research question he sought to answer: how are race times progressing as the sport grows, and how are those times affected by temperature changes?


Marshall is a wonderful athlete himself, with an April 2022 Fastest Known Time on the Buffalo River Trail in Arkansas, so he's used to moving fast. In his spare time, between research and Zoom calls, he compiled the data on finishing times and temperatures, controlling for years when there was snow on the course or when the course was altered.
"I may never run Western States," Marshall says. "But I can run statistics on it!"
He's doing world-changing work on climate change at Stanford University, and that made his quest have both a personal and academic interest. "This combines my research focus on the impacts of climate with my hobby of running slowly through the mountains," he says. Since this was a quick analysis for fun (and to help me with coaching; helps to have really, really smart friends), Marshall wants to be clear that the numbers could change. And I want to be clear that any errors are the fault of the field of Statistics for being the worst.
Let's all run fast through some of the fascinating data he gathered!Finding #1: Times of top finishers have progressed rapidly.
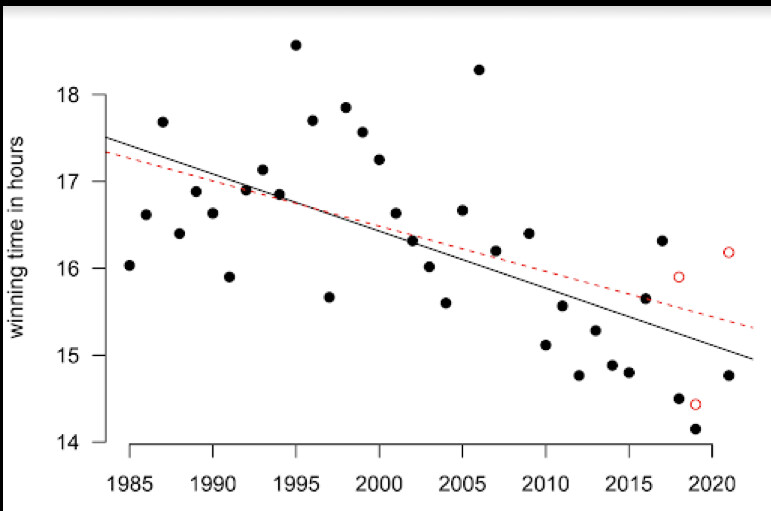
Since 2000, a linear model of top times for men and women shows bonkers improvement. Bonkers is a scientific term; you'd know it if you, like me, took an Intro To Stats class in 2004. The male winner is about 2 hours faster on average, with the same general improvement for the average of places 2 through 5. The female winners are around 1 hour faster, with places 2 through 5 improving more than 2 hours.When not accounting for temperature, times would be expected to drop considerably each year-around 4 minutes per year for men since the 1980s, and about 4:45 per year for women. Interestingly, the women's top 5 times are coming down faster than the winning time, showing a tighter race at the front.
I asked Marshall to run the men's times with Jim Walmsley being removed. Want to see a cool chart of just how much of an outlier he is? Taking out Jim's winning times moved the linear regression substantially, with the new red line predicting substantially slower times overall. And if he didn't get lost in 2016, the effect would be even more pronounced! You know you're a good runner when you mess up the statistics.
Finding #2: For all finishers, men are improving gradually, while women are improving rapidly.
Since 2000, the average women's finish time has improved by 5 minutes and 15 seconds per year! Meanwhile, the average finisher independent of gender has only improved around 2 minutes per year. So women are driving the sport forward in an emphatic way! Bosses!
Finding #3: Heat has a massive performance impact.
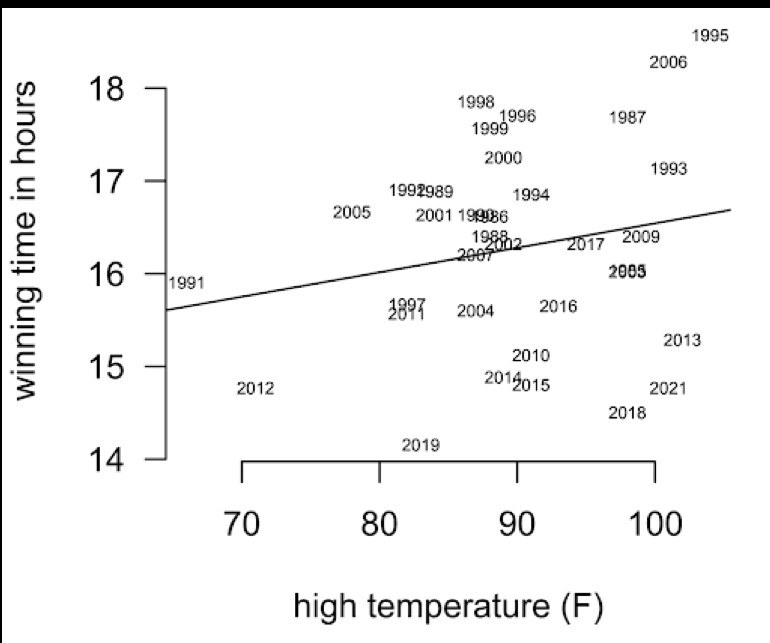
Let's start with a simple scatterplot of heat versus winning time.There is clearly a ton of variation in the scatter. Heat is not destiny. But there is some clear relationship, so maybe it's destiny's child. If you go too hard on a hot day, the body has to pay the bills bills bills later.
Marshall ran multiple regression analyses to combine the effects of overall time improvements with heat increases to give us a more sophisticated analysis, again also controlling for whether there was snow on the course. He is so damn sophisticated! Using times since 2000, the general rule is that for every 1 degree F increase in temperature in Auburn, California on race day, there is a 2:48 increase in winning time for men and a 2:52 increase for women. Removing Jim's times (Mr. Mess-Up-Your-Stats), there is a 3:26 increase for men for every degree increase.
For the average finisher using the same regression analysis, 1 degree F increases correspond with 2:34 increases in finishing times. DNFs go up about 0.5% for every 1 degree F increase as well. The ratio of times for men and women is not significantly impacted by temperature, so even though the hot year in 2021 saw women absolutely rock the list of top finishers, that may not be explained by heat in the way that everyone assumed.Finding #4: Predictions for 2022
The forecast from Weather Underground is currently 97 degrees F on race day in Auburn, relative to an average of 89. Combining the heat data with the overall improvement in times as the sport progresses, here are the predictions from Marshall's model, again based on data from the last 20 years.
For the male winner, it depends heavily on whether we remove Jim from the data. Assuming Jim is a true outlier, we can expect a winning time around 15 hours. For women, it's 17.5 hours. For the average racer, times should be around a half hour slower than normal, but that is affected by a higher DNF rate, so I'd suggest athletes build in much more buffer.
The trend in the 10th place times is most instructive to me, as a coach that is trying to help support athletes getting an invitation to next year's race. Those 10th place times have come down by massive margins over time, 9:22 for men and 12:50 for women. But the times are also more affected by the heat relative to the top 5 finishers. Put it all together, and the model predicts that 20 hours will place in the top-10 for women, and around 17 hours for men.
My personal prediction will be for fast winning times, but a greater spread after that, with the 10th place man and woman being around 30 minutes slower than predicted. The faster times as the sport progresses will not follow a linear model eventually, and my guess is that we are starting to approach an asymptote. To paraphrase Mark Twain, there are lies, damn lies, Statistics, and a running coach pulling wild guesses out of his butt.
Three Big Conclusions
Respect the heat, but don't respect it too much.
It's good to have brilliant friends like Marshall when you're looking for a possible coaching advantage.
Finally, Jim Walmsley breaks statistics.
by trail Runner Magazine
Login to leave a comment


